Project 1: Data visualization
Curiosity:
what I want to know when I am addicted to mobile phones and why mobile phones attract me so much .
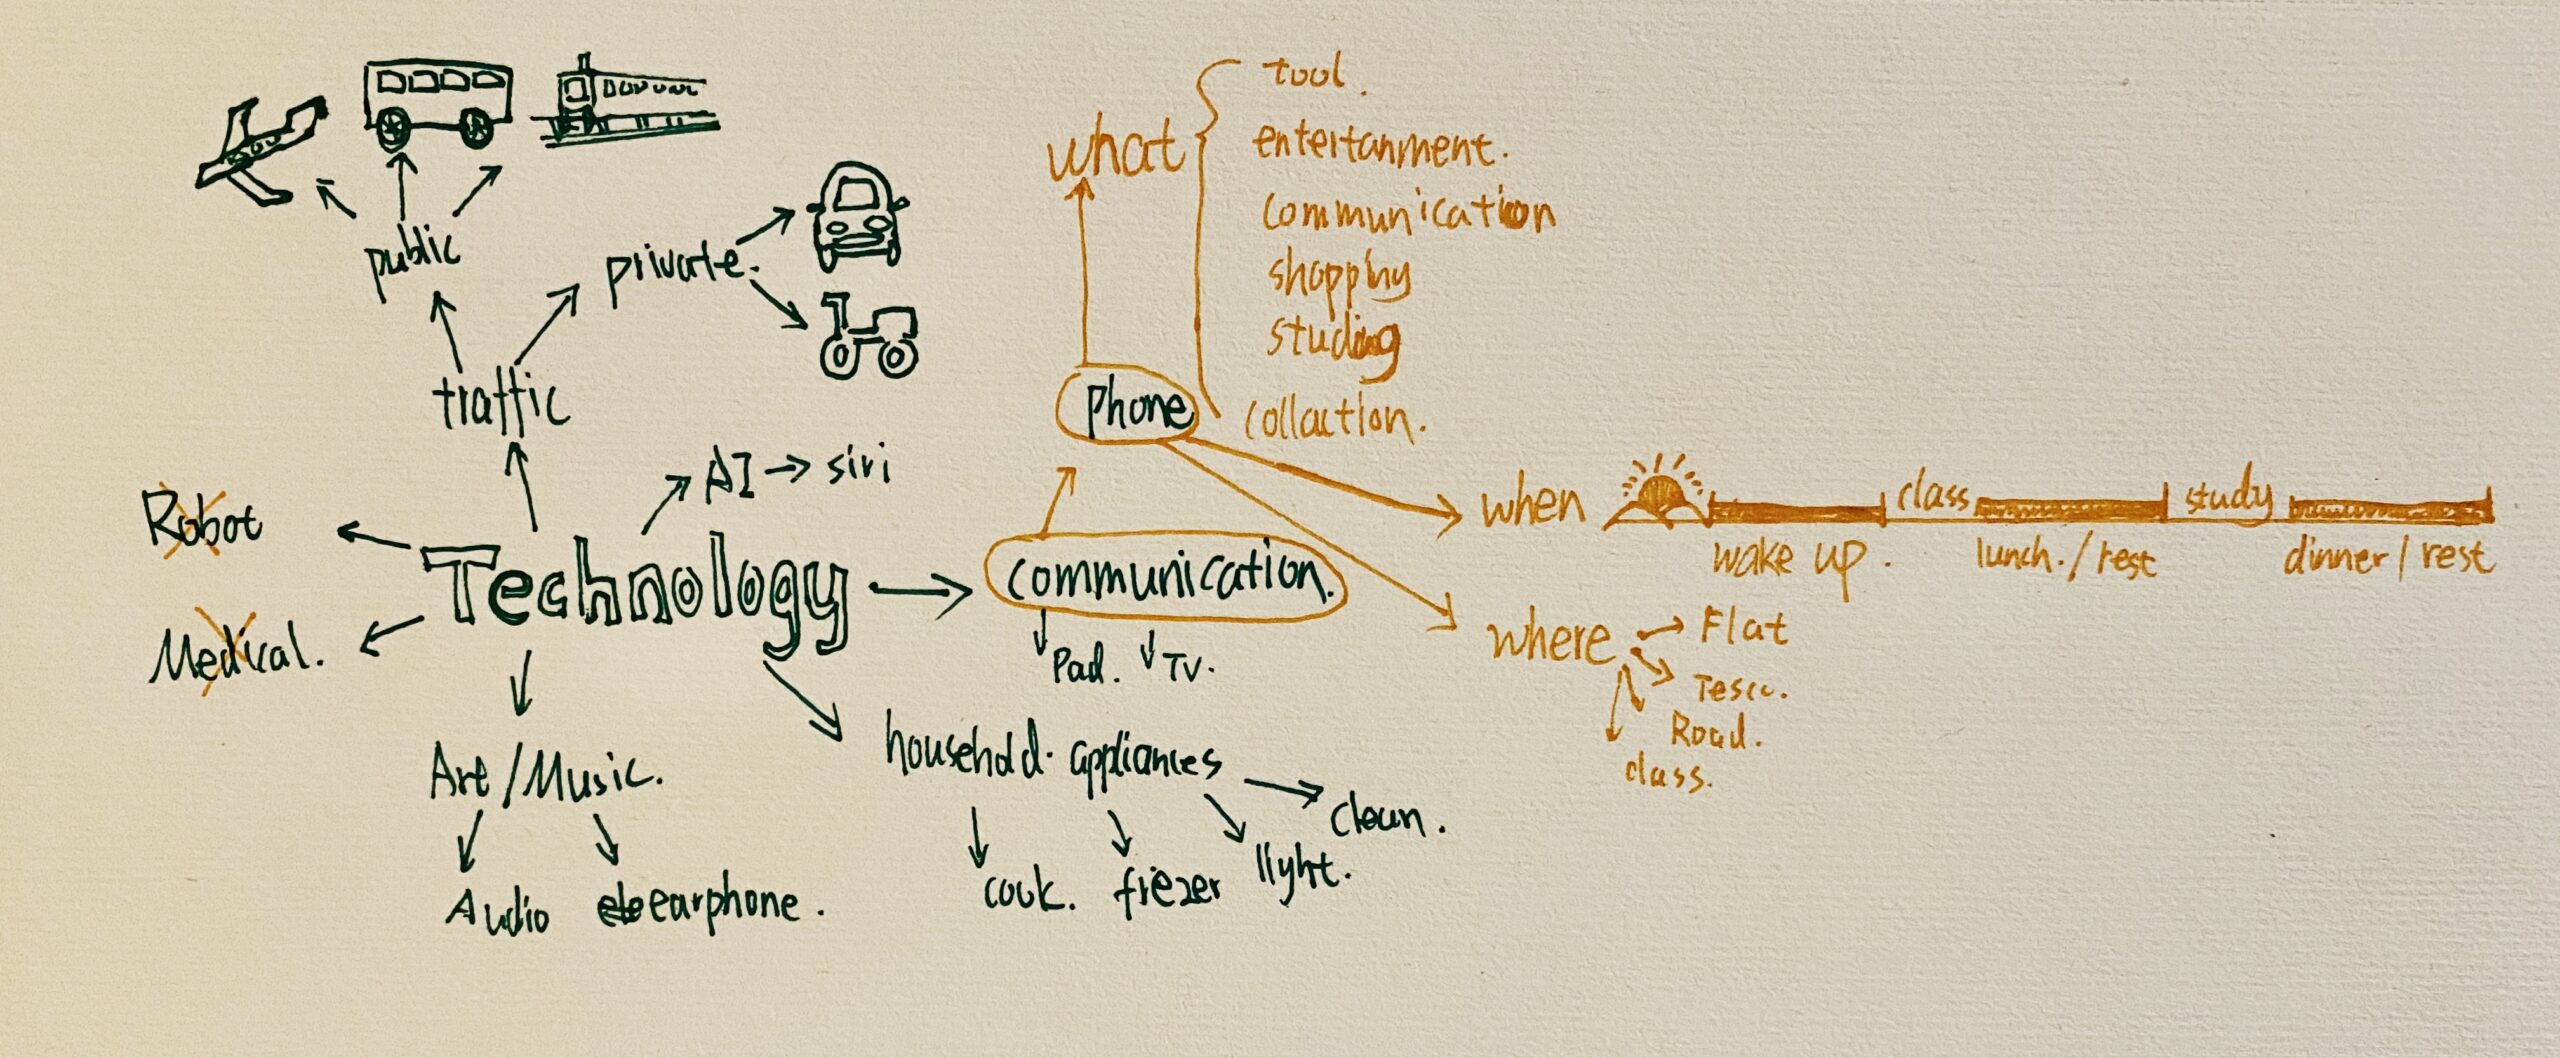
Preliminary research:

Mobile phone addiction tendencies and various factors are significantly negatively correlated with interpersonal adaptability, and significantly positively correlated with alexithymia (Zhang Yali, Lu Guizhi, Jin Tonglin et al. 2018). College students’ self-control and interpersonal adaptability play a chain-like mediating role in the relationship between self-esteem and mobile phone addiction tendency (Zhang Yali, Lu Guizhi, Song Xiangmei et al. 2018). There is a close relationship between mobile phone addiction tendency and interpersonal relationship disturbance and loneliness. Loneliness plays a part of mediating role in the relationship between mobile phone addiction tendency and interpersonal relationship disturbance (Tang Wenqing, Huang Xian, Wang Enjie, 2018).Zhang Yali, Lu Guizhi, Jin Tonglin, Li Sen, Jiang Huaibin, Liang Li. (2018). The influence of propensity on interpersonal adaptability: the mediating role of alexithymia. China Special Education, 2.
Zhang Yali, Lu Guizhi, Jin Tonglin, Li Sen, Jiang Huaibin, Liang Li. (2018). The influence of propensity on interpersonal adaptability: the mediating role of alexithymia. China Special Education, 2.
Tang Wenqing, Huang Xian, Wang Enjie. (2018). The relationship between propensity and interpersonal disturbance and loneliness. Chinese Mental Health Journal, 32(12): 1045-1049
The first Story:
During whole days, I spend a lot of time on my mobile phone. As an objective technology product, the mobile phone is like countless invisible threads that connect all aspects of my life: where I am, my experience, my mood, and so on. Although the mobile phone is an intermediary tool for me to establish contact with all aspects of life, it also affects my life and occupies most of my life. Sometime I feel that the mobile phone is my master. I want to show how the mobile phone ” occupy” my life through time, place, and psychological data from multiple angles.
Data collection:
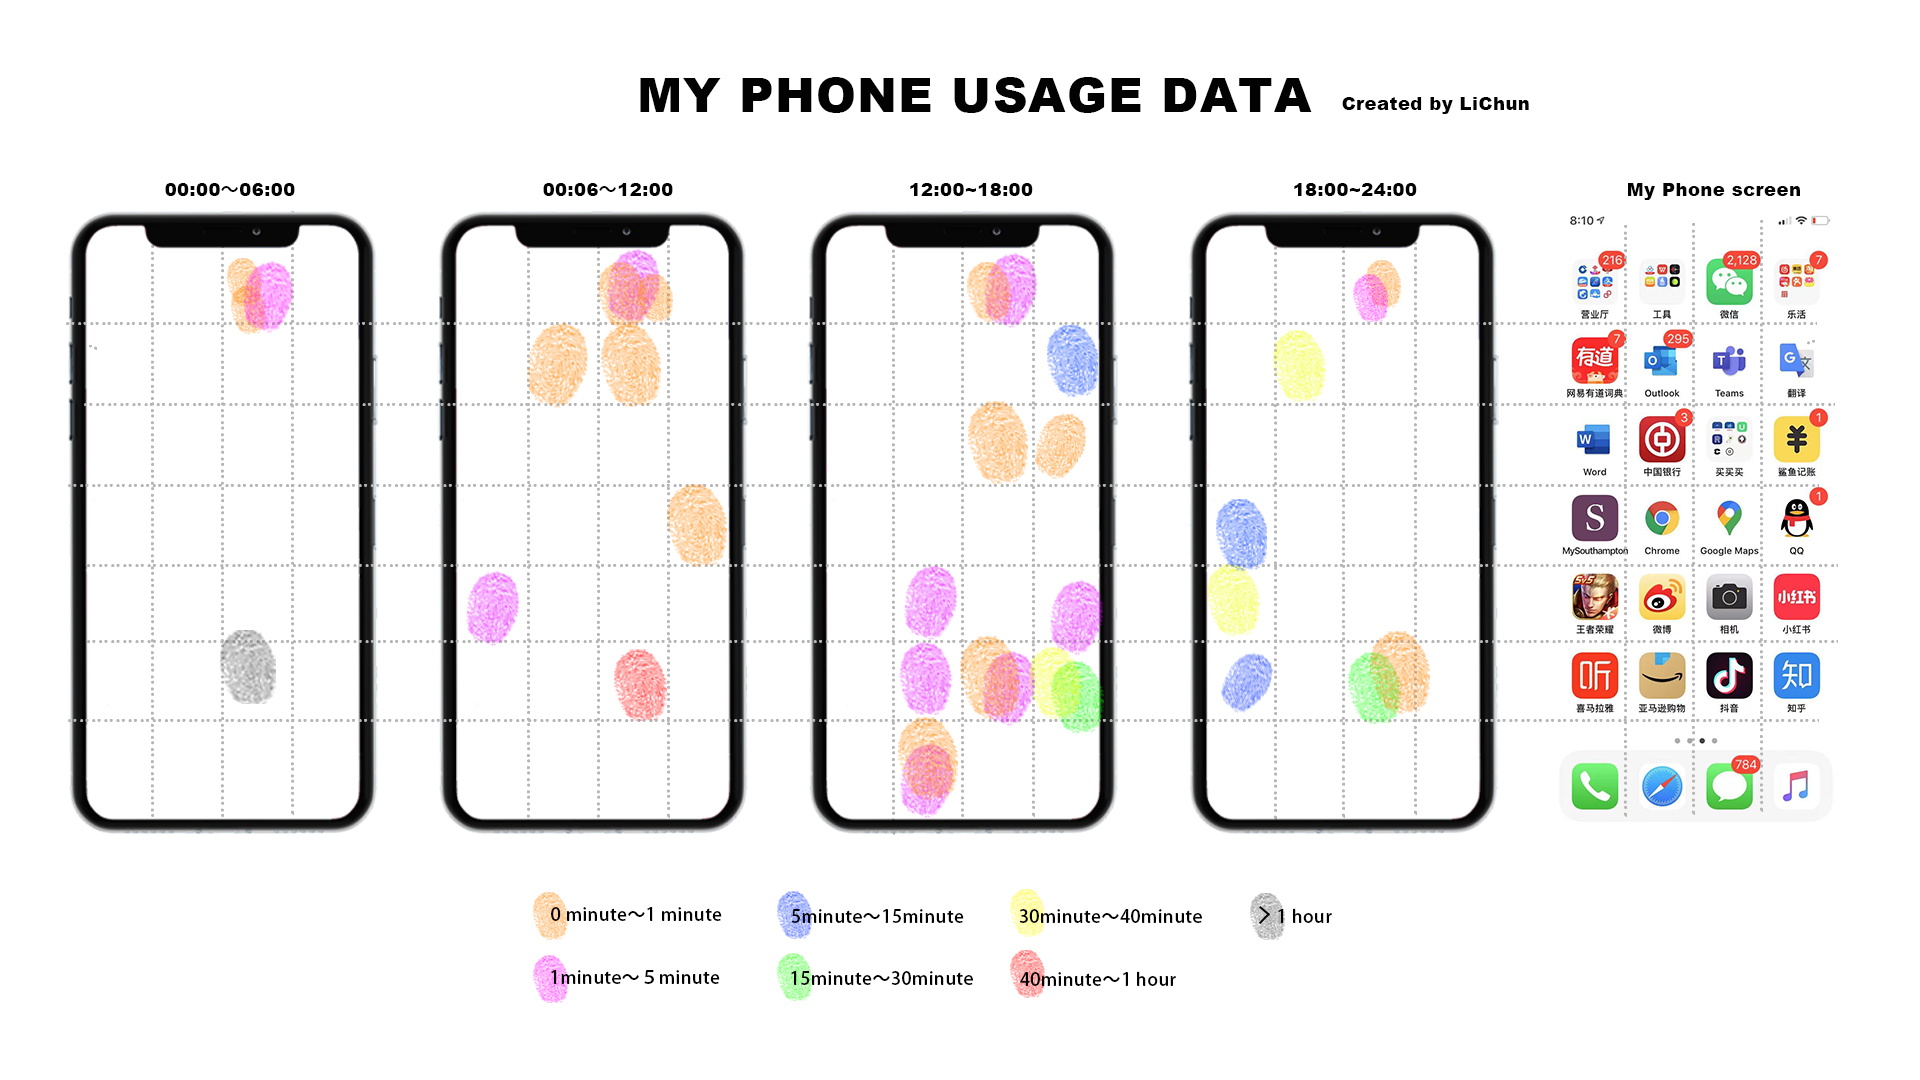
This is my mobile phone usage data in one day.

The following is my mobile phone usage data recorded from the six perspectives of “App, mood/impact; time; duration; purpose; location” within 24 hours.

Inspiration:

Lines:
The application function of lines in data visualization: it can express the changing trend and the connection between different elements. The density relationship generated by the lines can reflect the amount of data, such as the airline route data graph. The line shows the data information of the flight location and number of flights.
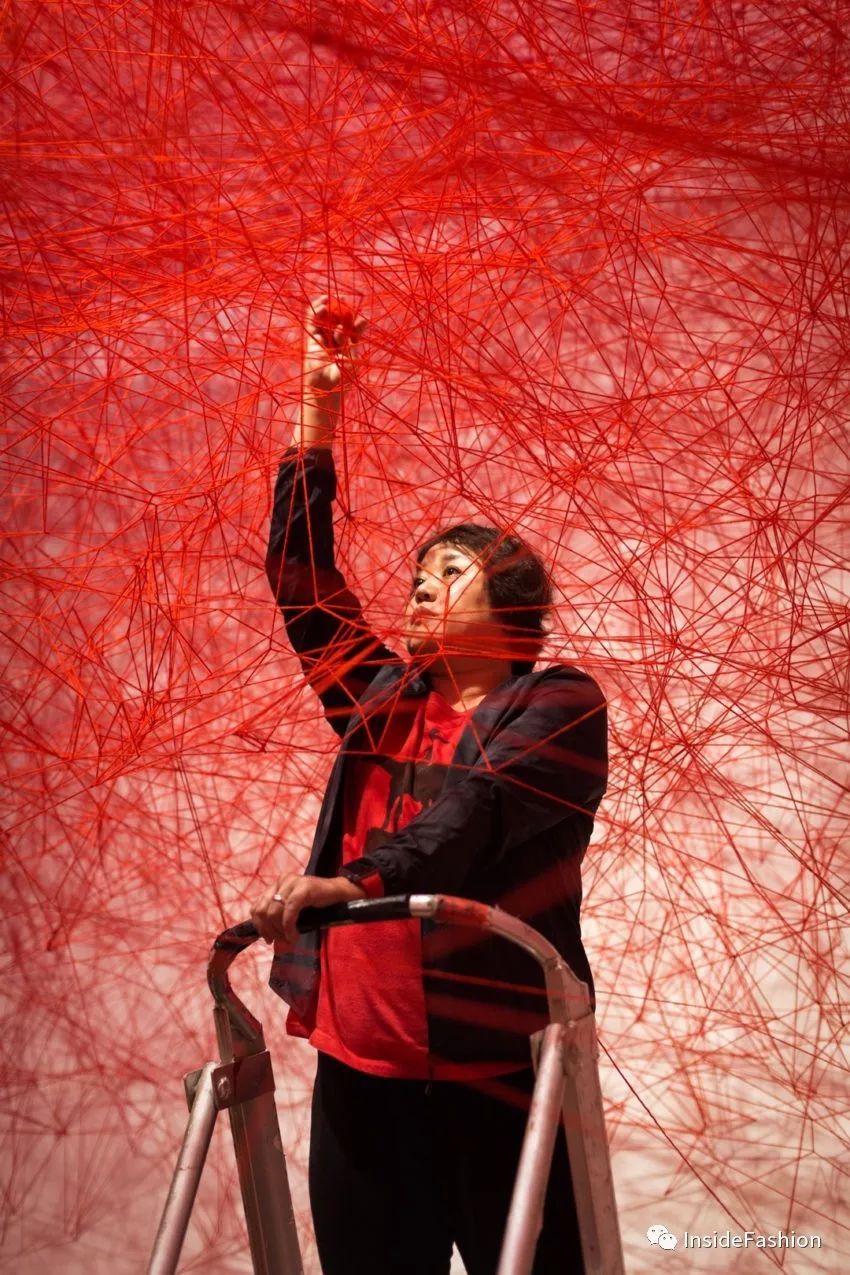
Line works of CHIHARU SHIOTA:
Connecting people to people, objects, and heart, memory, and life dialogue, “How can we live an optimistic life, how can we transform anxiety into strength, I think everyone should be shaken through this exhibition.”
ShoppingDesign. 2021. Shioda Chiharu: The trembling soul | ShoppingDesign. [online] Available at: <https://www.shoppingdesign.com.tw/post/view/6574> [Accessed 19 June 2021].
So I also want to use “lines” to show the inextricable connection between the mobile phone and my life. The traces left by the mobile phone usage data are connected and reflect my life.

Three-dimensional visualization of data:
This geographic map displays data from three dimensions: longitude/latitude/elevation.
Preliminary idear model:
The corner reflector provides inspiration for my design concept: the light beam can touch the data points on the three mutually perpendicular coordinate axis screens through the principle of reflection, and connect different data information to form a three-dimensional polyline segment data graph.

In optics, corner reflectors typically consist of three mirrors or reflective prism faces which return an incident light beam in the opposite direction. Optical corner reflectors, called corner cubes or cube corners, made of three-sided glass prisms, are used in surveying and laser ranging.
From Wikipedia, the free encyclopedia
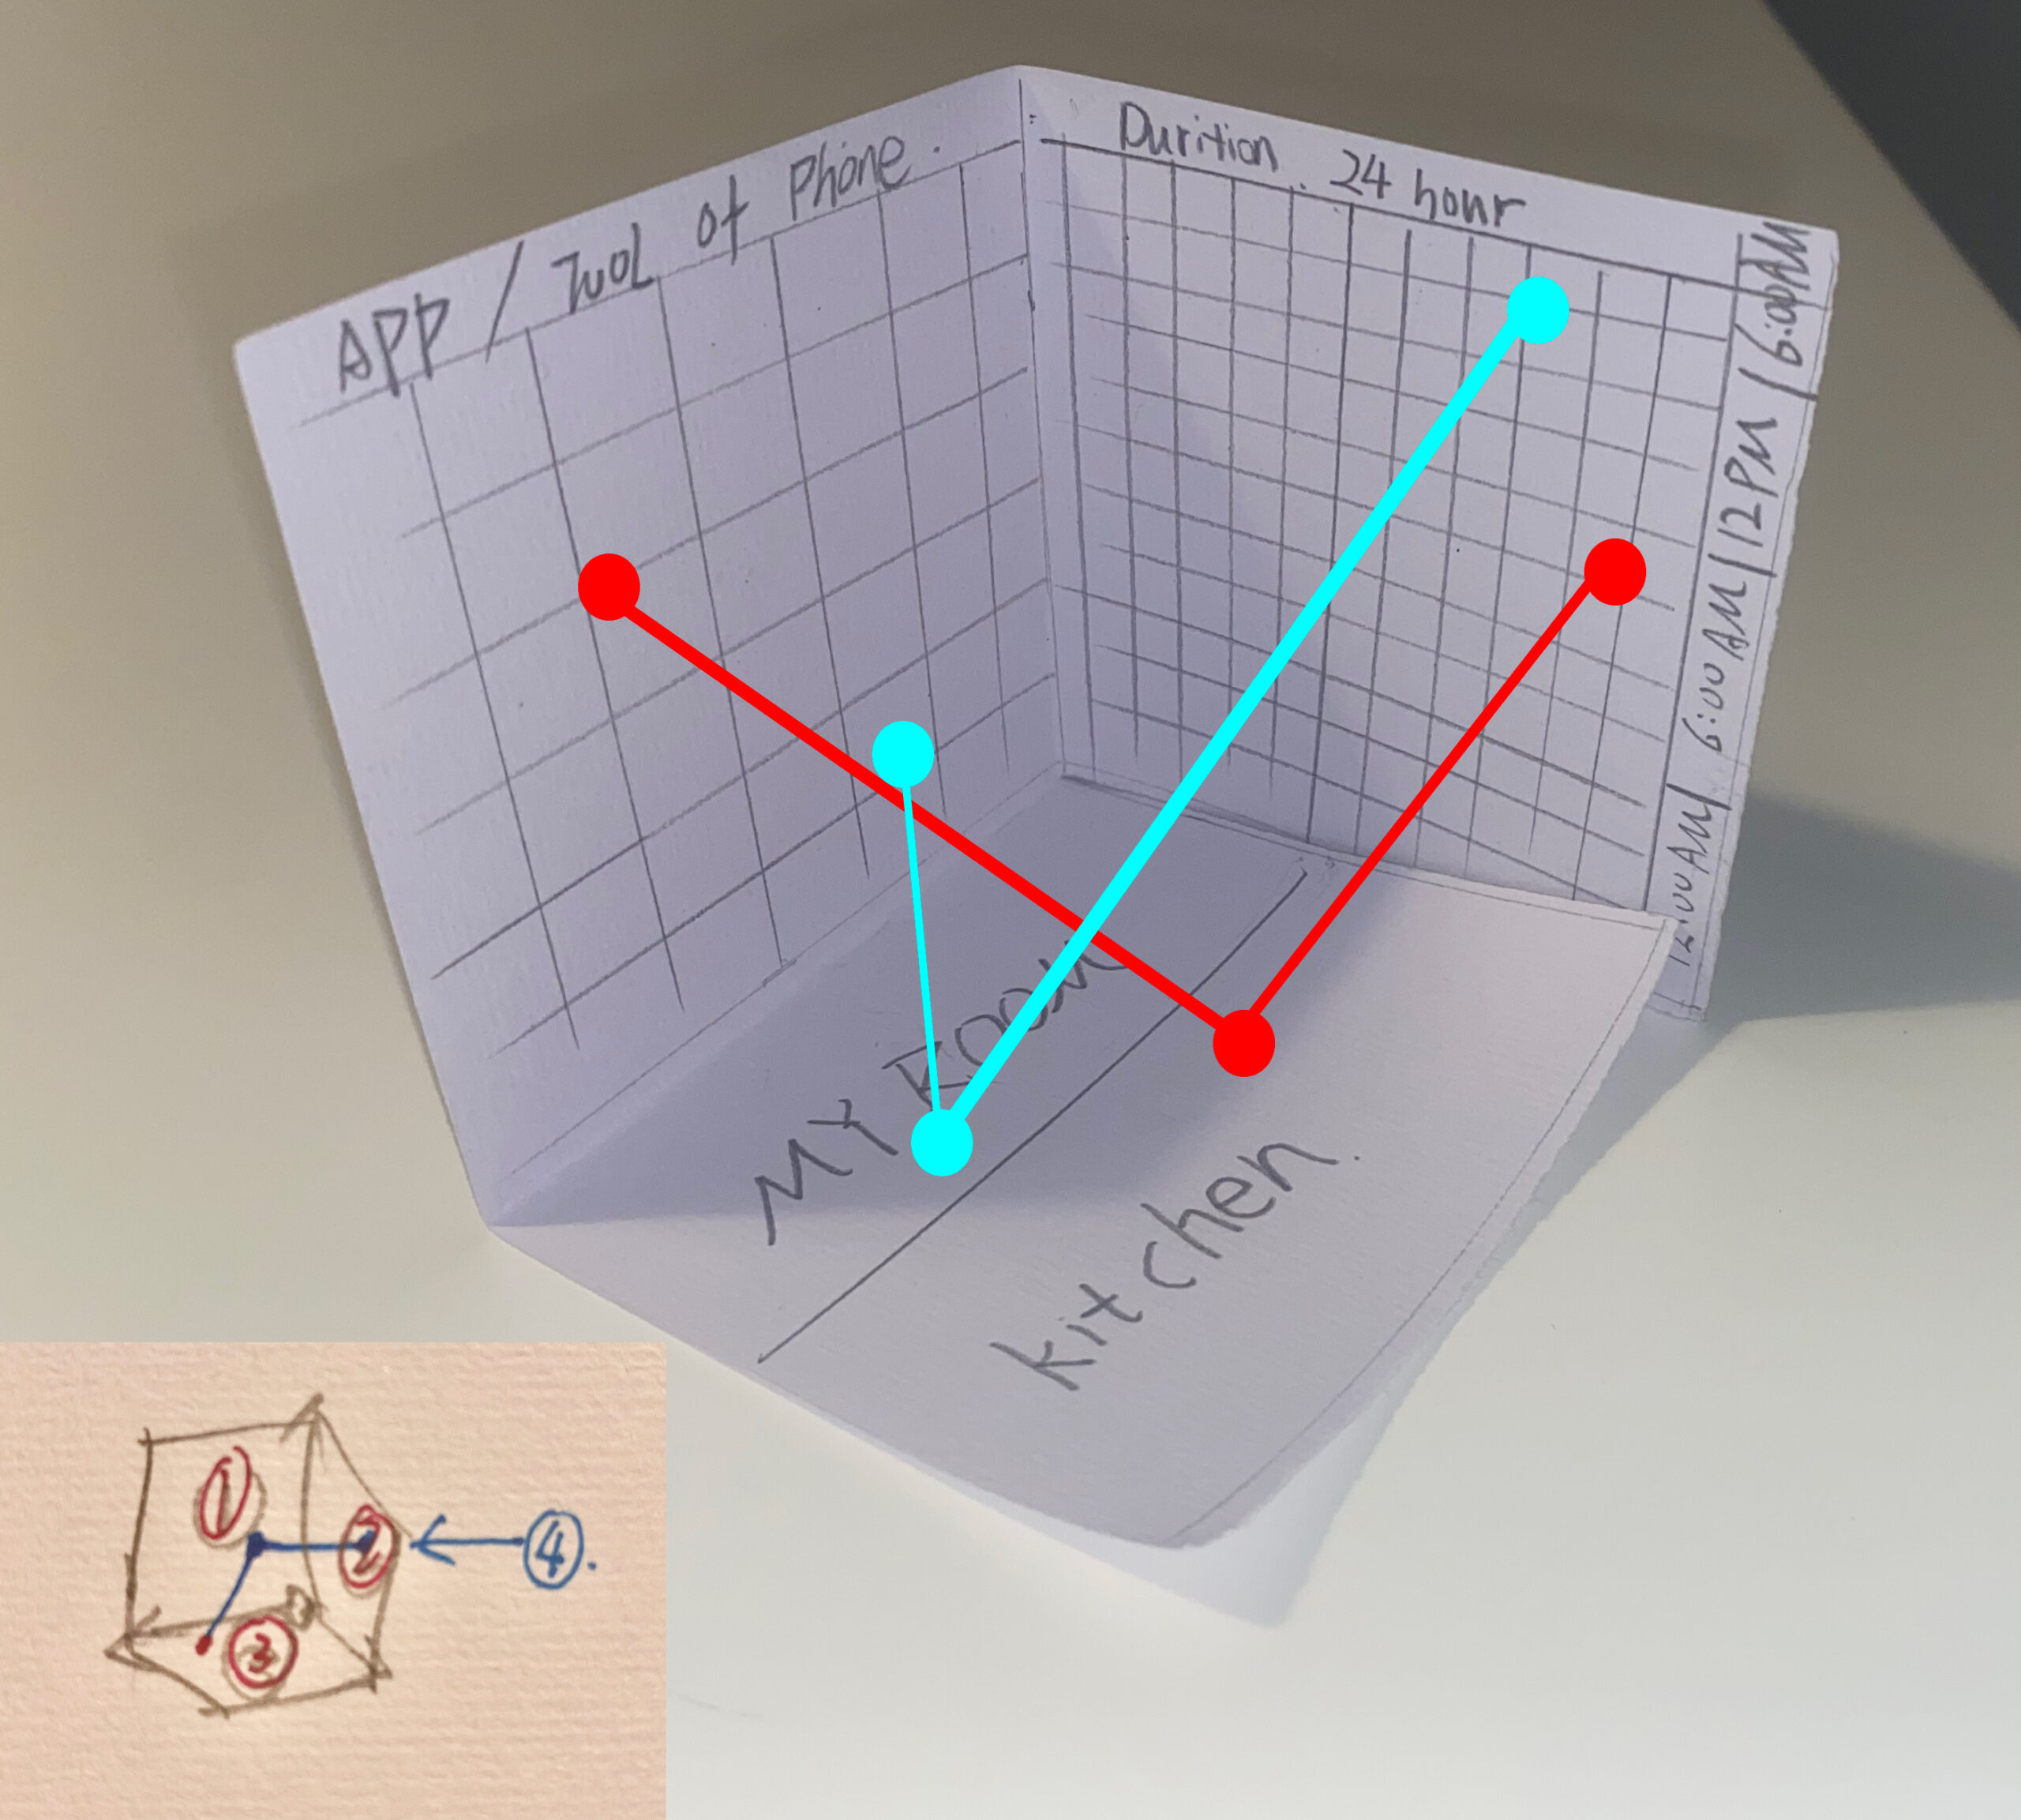
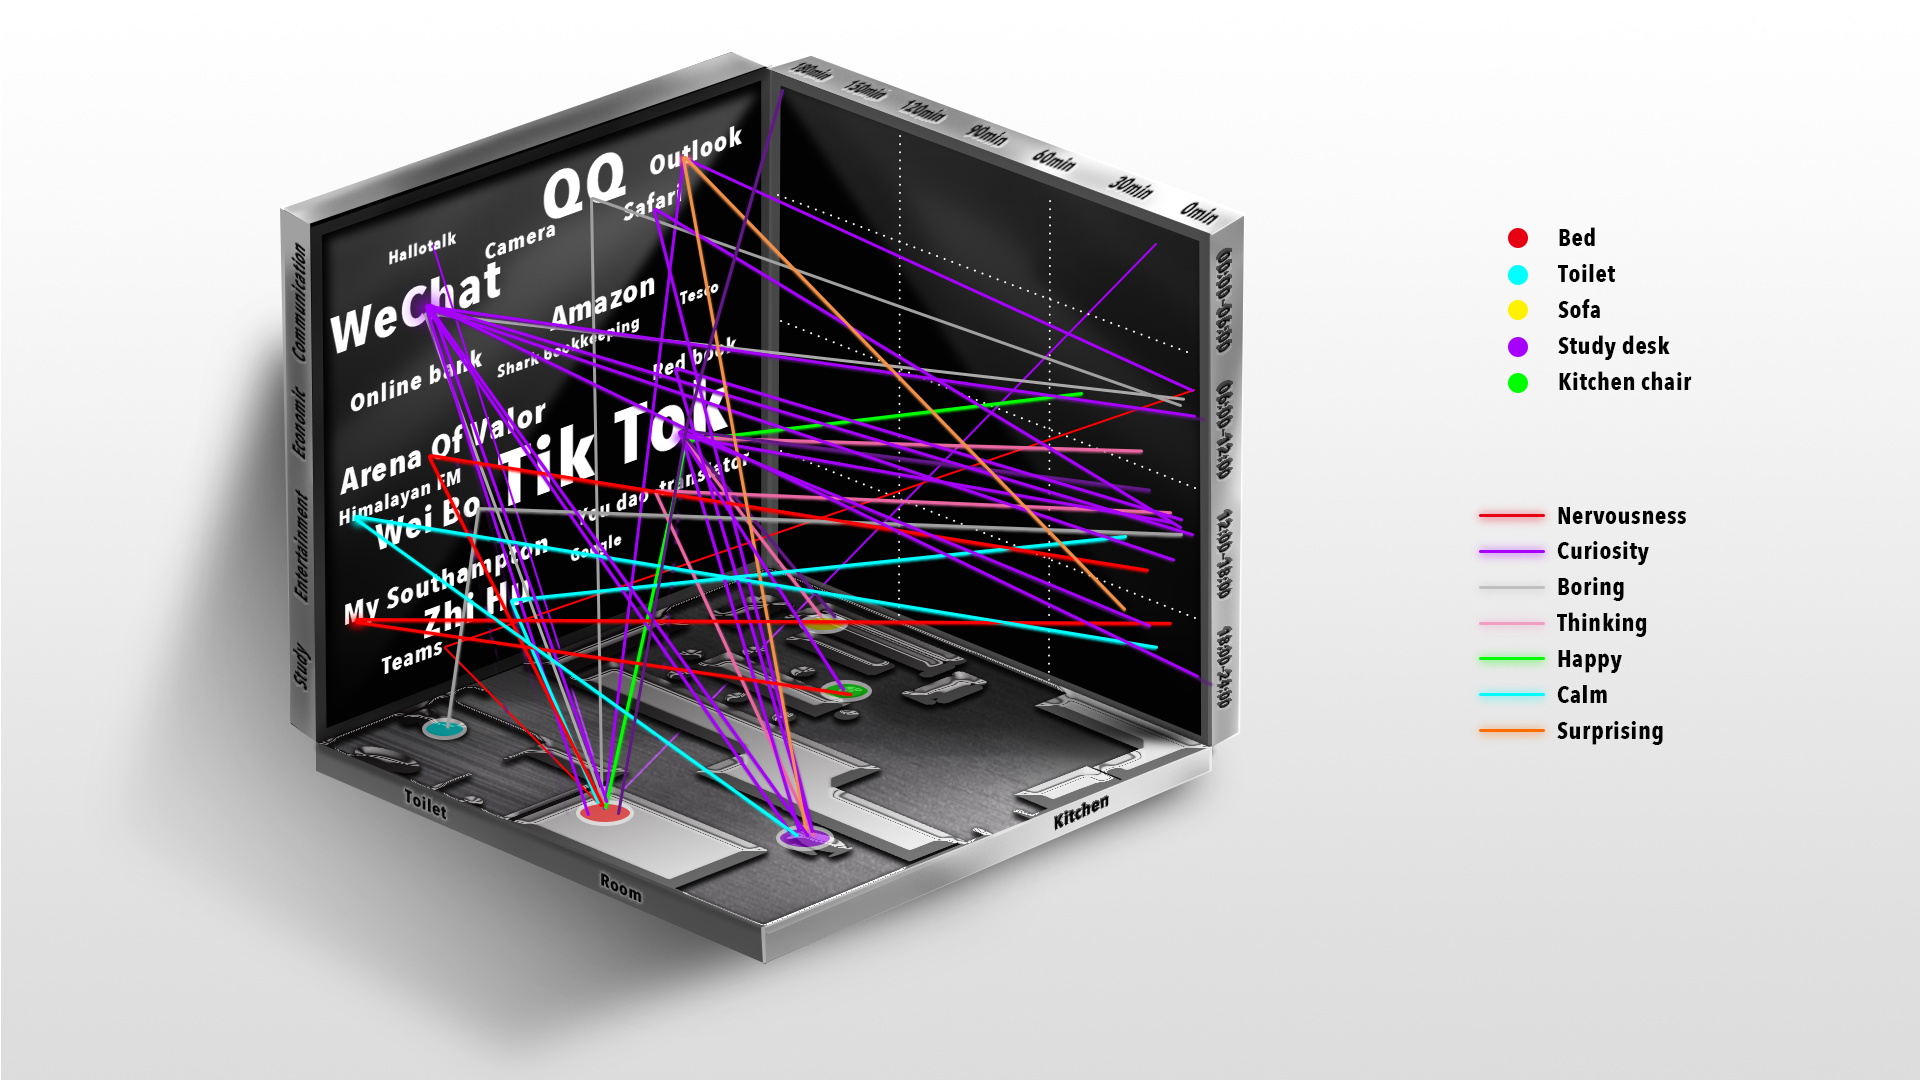
My visual data works are displayed from four dimensions: mobile application tools, using time, location, and mood(different mood have different color).
Detail design
Color of line

Click to read resource : https://www.verywellmind.com/color-psychology-2795824
Blue calls to mind feelings of calmness or serenity. It is often described as peaceful, tranquil, secure, and orderly.
This stimulating red is also associated with excitement.
Studies show that being exposed to or wearing red can cause some of the following physical effects:
- Elevated blood pressure
- Enhanced metabolism
- Increased heart rate
- Increased respiration rate
the color green might give us an optimism bias when it comes to remembering information.
Purple also represents curiosity. Its rare and mysterious nature perhaps causes it to seem connected to the unknown, supernatural, and divine.
For other readers, pink gives off a creative and artistic vibe. “I do not wear pink but I am drawn to it for my study where I do not have to compromise with my husband,” said another reader. “It is a happy color and it makes me feel creative.
Orange calls to mind feelings of supprice excitement, enthusiasm, and warmth.
Orange is often used to draw attention, such as in traffic signs and advertising.
Grey exists in nature most frequently as an overcast sky and in our man-made environment as the dreary overbearing oppressive concrete jungle we’ve surrounded ourselves with. Maybe our brains have learned to associate this greyness with an absence of sunlight, and this has persisted into our modern psychology.
My life map
I scanned the 3D map of my dormitory, and based on the objective scan results, I drew my map structure. The map is drawn to show “where do I often play on my mobile phone-geographic location data”.

Kitchen 
Toilet 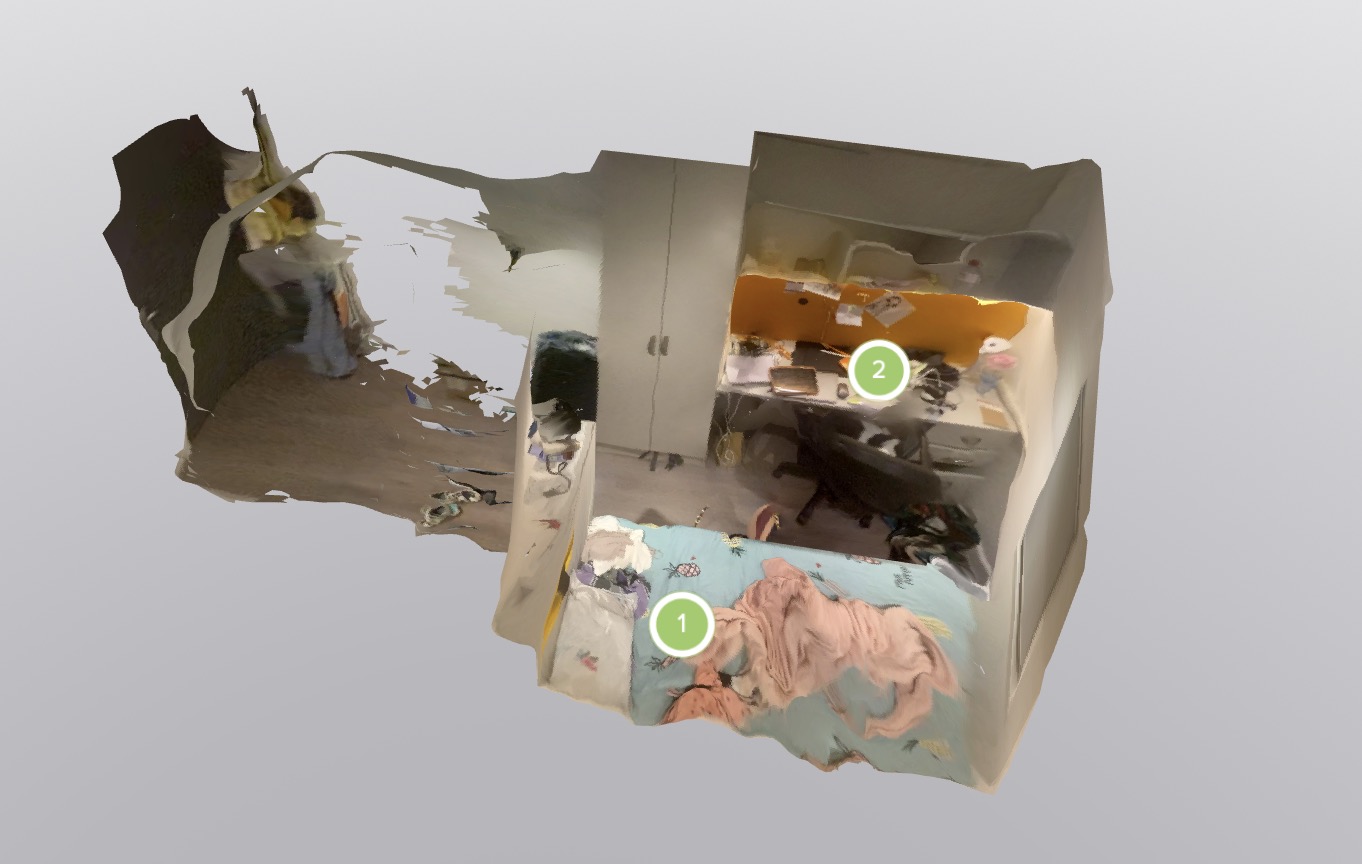
Room
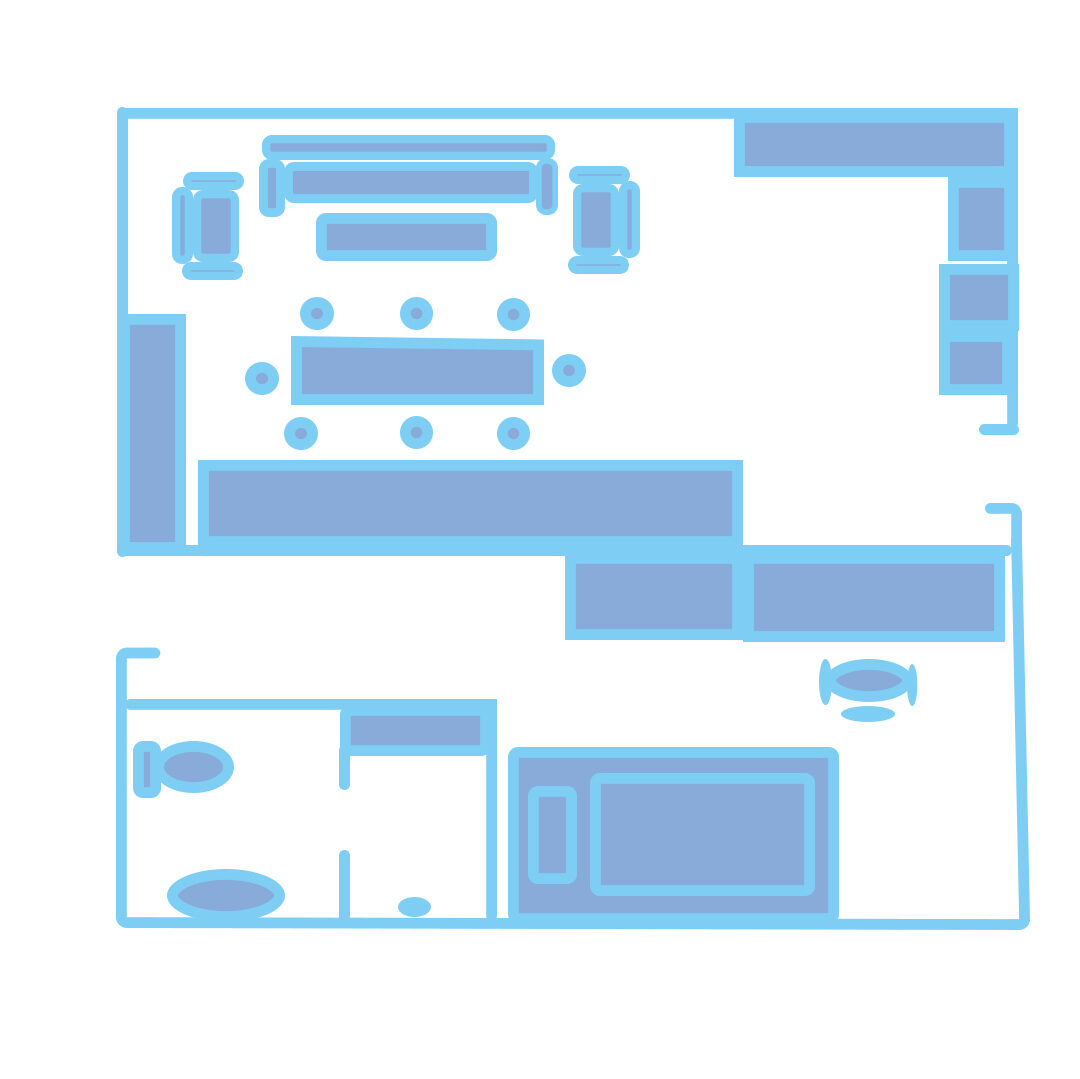
This is a map of my living area drawn. On this basis, I will model the map three-dimensionally.
Final idear——Outcome
The concept of my final idea is to create an interactive three-dimensional map of data to visualize the behavioral data of my mobile phone use, and to show the audience abstractly the state of my mobile phone use-time, place, software, emotions.
I will create my own “Data Ray” based on the inspiration of “Line works of CHIHARU SHIOTA”. I will use lines, time axis, geographic plan, and color to combine a data model, which will represent the story that happened with my phone on a certain day.
The purpose of this concept is to allow anyone to interact and watch my mobile phone usage information, regardless of whether the audience directly touches my mobile phone, they can learn about my mobile phone usage information through interaction. The viewer only needs to touch any screen content of this three-sided, box-like screen, and the screen will provide detailed data through rays. For example, when your finger taps the TikTok icon on the screen, rays will radiate from the icon and connect with digital information points on other screens to form a three-dimensional data map.
In addition, as part of the visualization data, I will use different colored lines to express different emotional information. People can feel my mental activities when using a mobile phone through the density of the colors and the time coordinates of these different rays. More importantly, the line can connect different information points, so that the originally scattered data information that is not in the same dimension (coordinate) can be connected into a whole, which is more convenient for the audience to read my data from multiple angles, and the reader can even connect these well. Imagine a story: “The author lay in bed and watched a three-hour Douyin video at 12 o’clock in the middle of the night. There must be some fun content that attracted her deeply. “In this way, people can not only experience my story. , You can also imagine creating stories and making them their experience.
Smart touch screen display, HMW, stereo screen Support my visual data graph。
Data visualization outcome 1
Data visualization 2
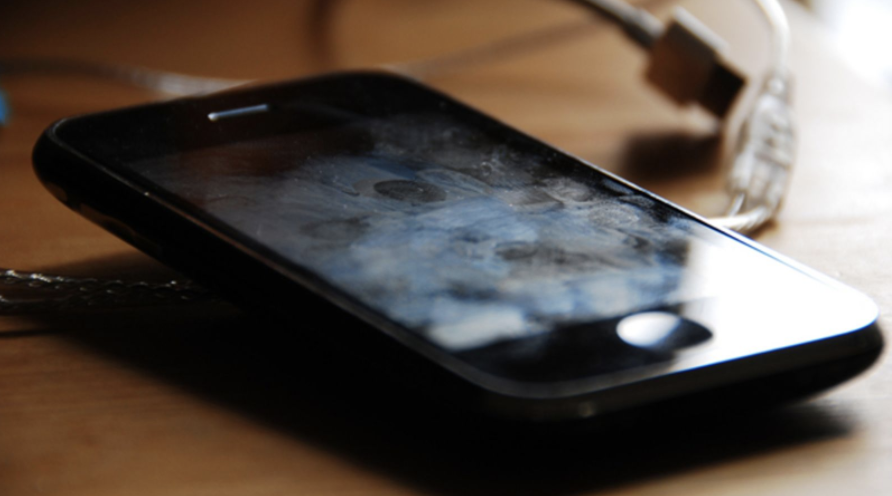
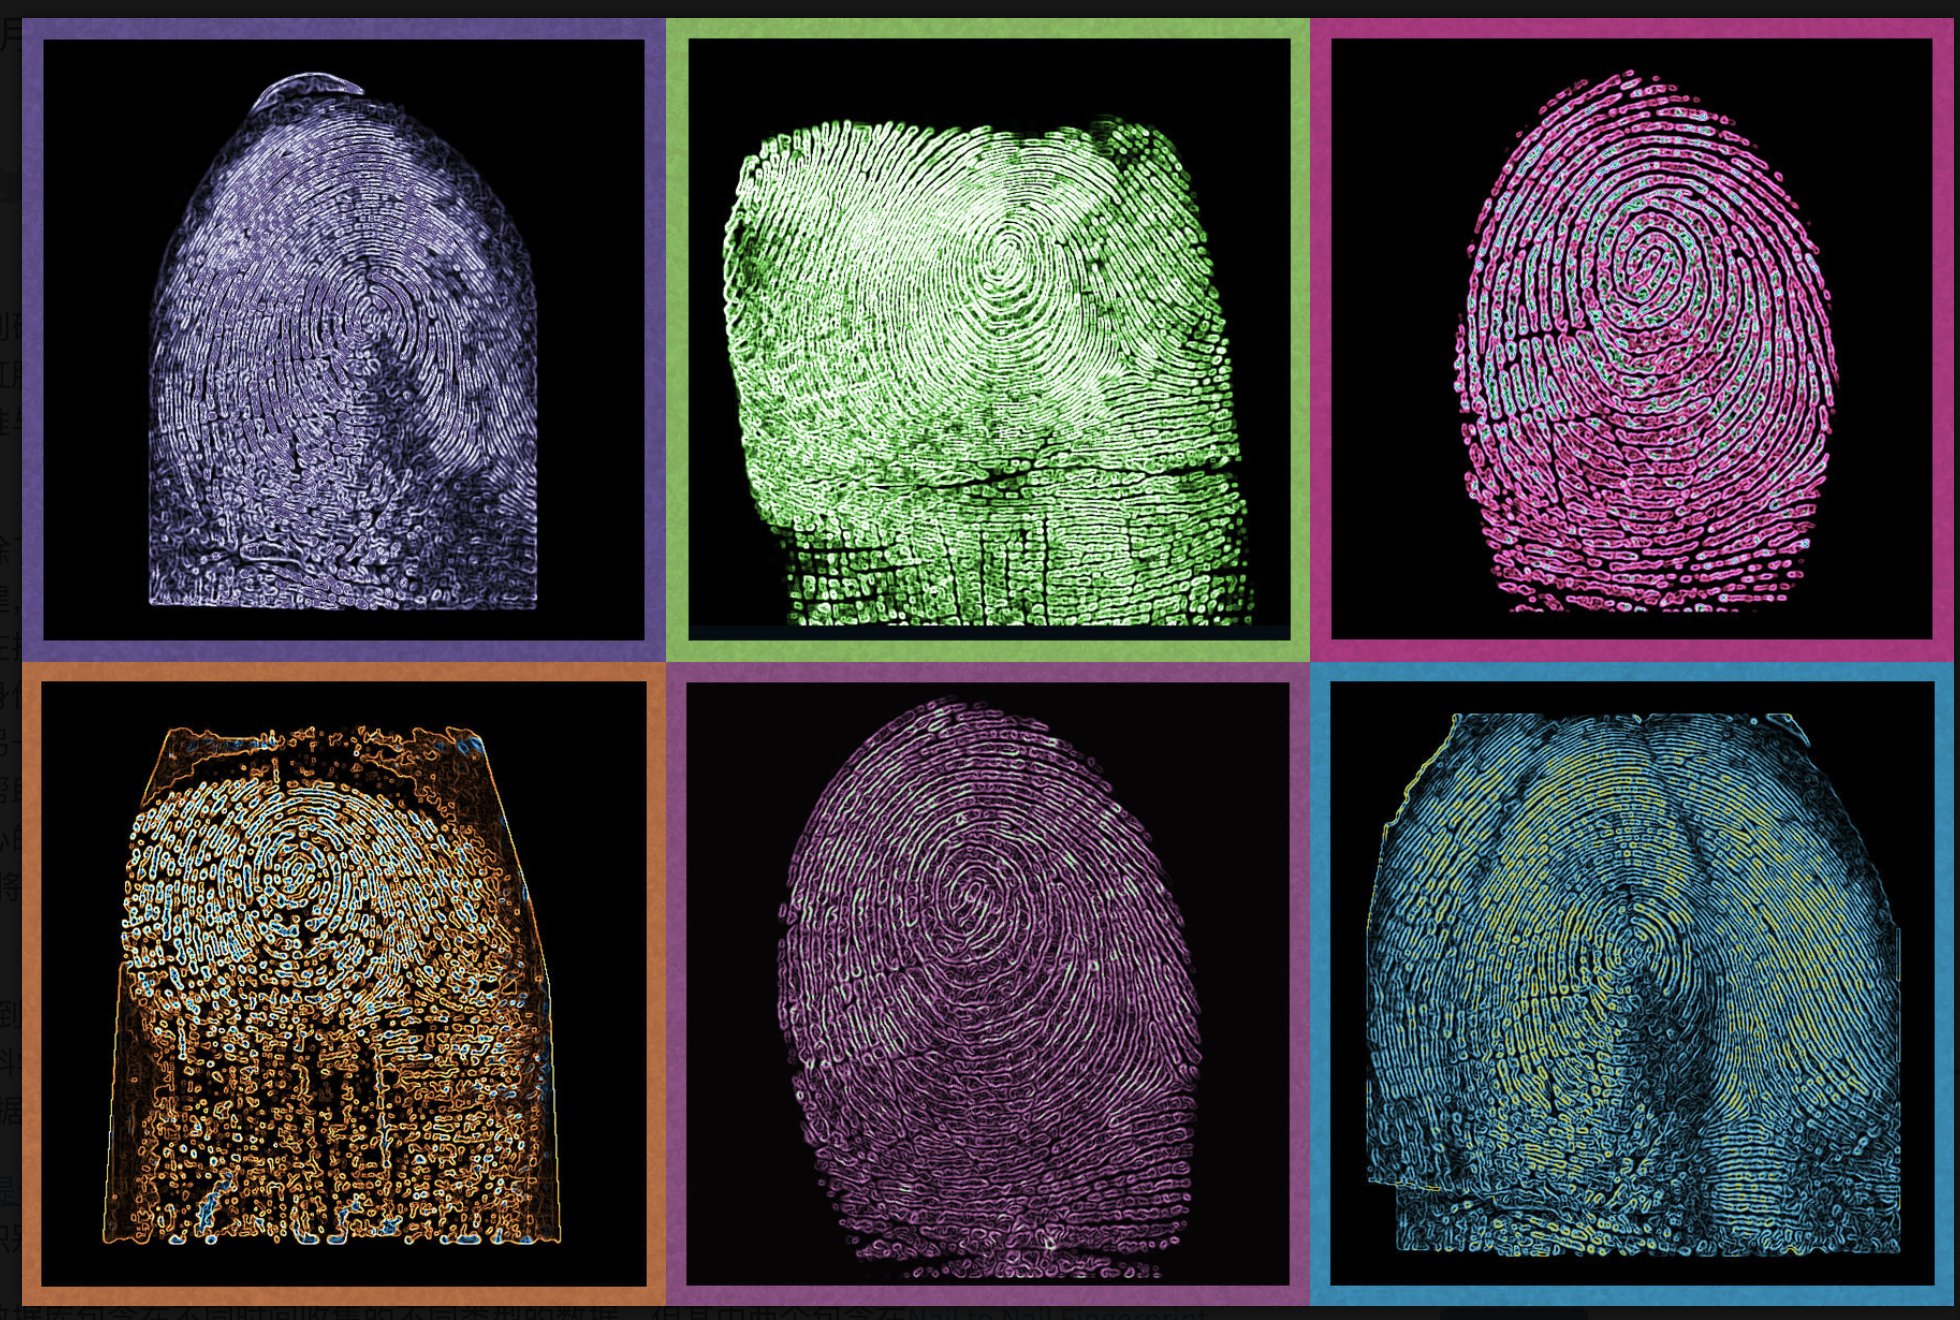
Fingerprints show my status when using each software: data (purpose, idea, idea, acquisition, frequency)
Outcome 2
